
Research
Monitoring permafrost thaw at regional and continental scales from space
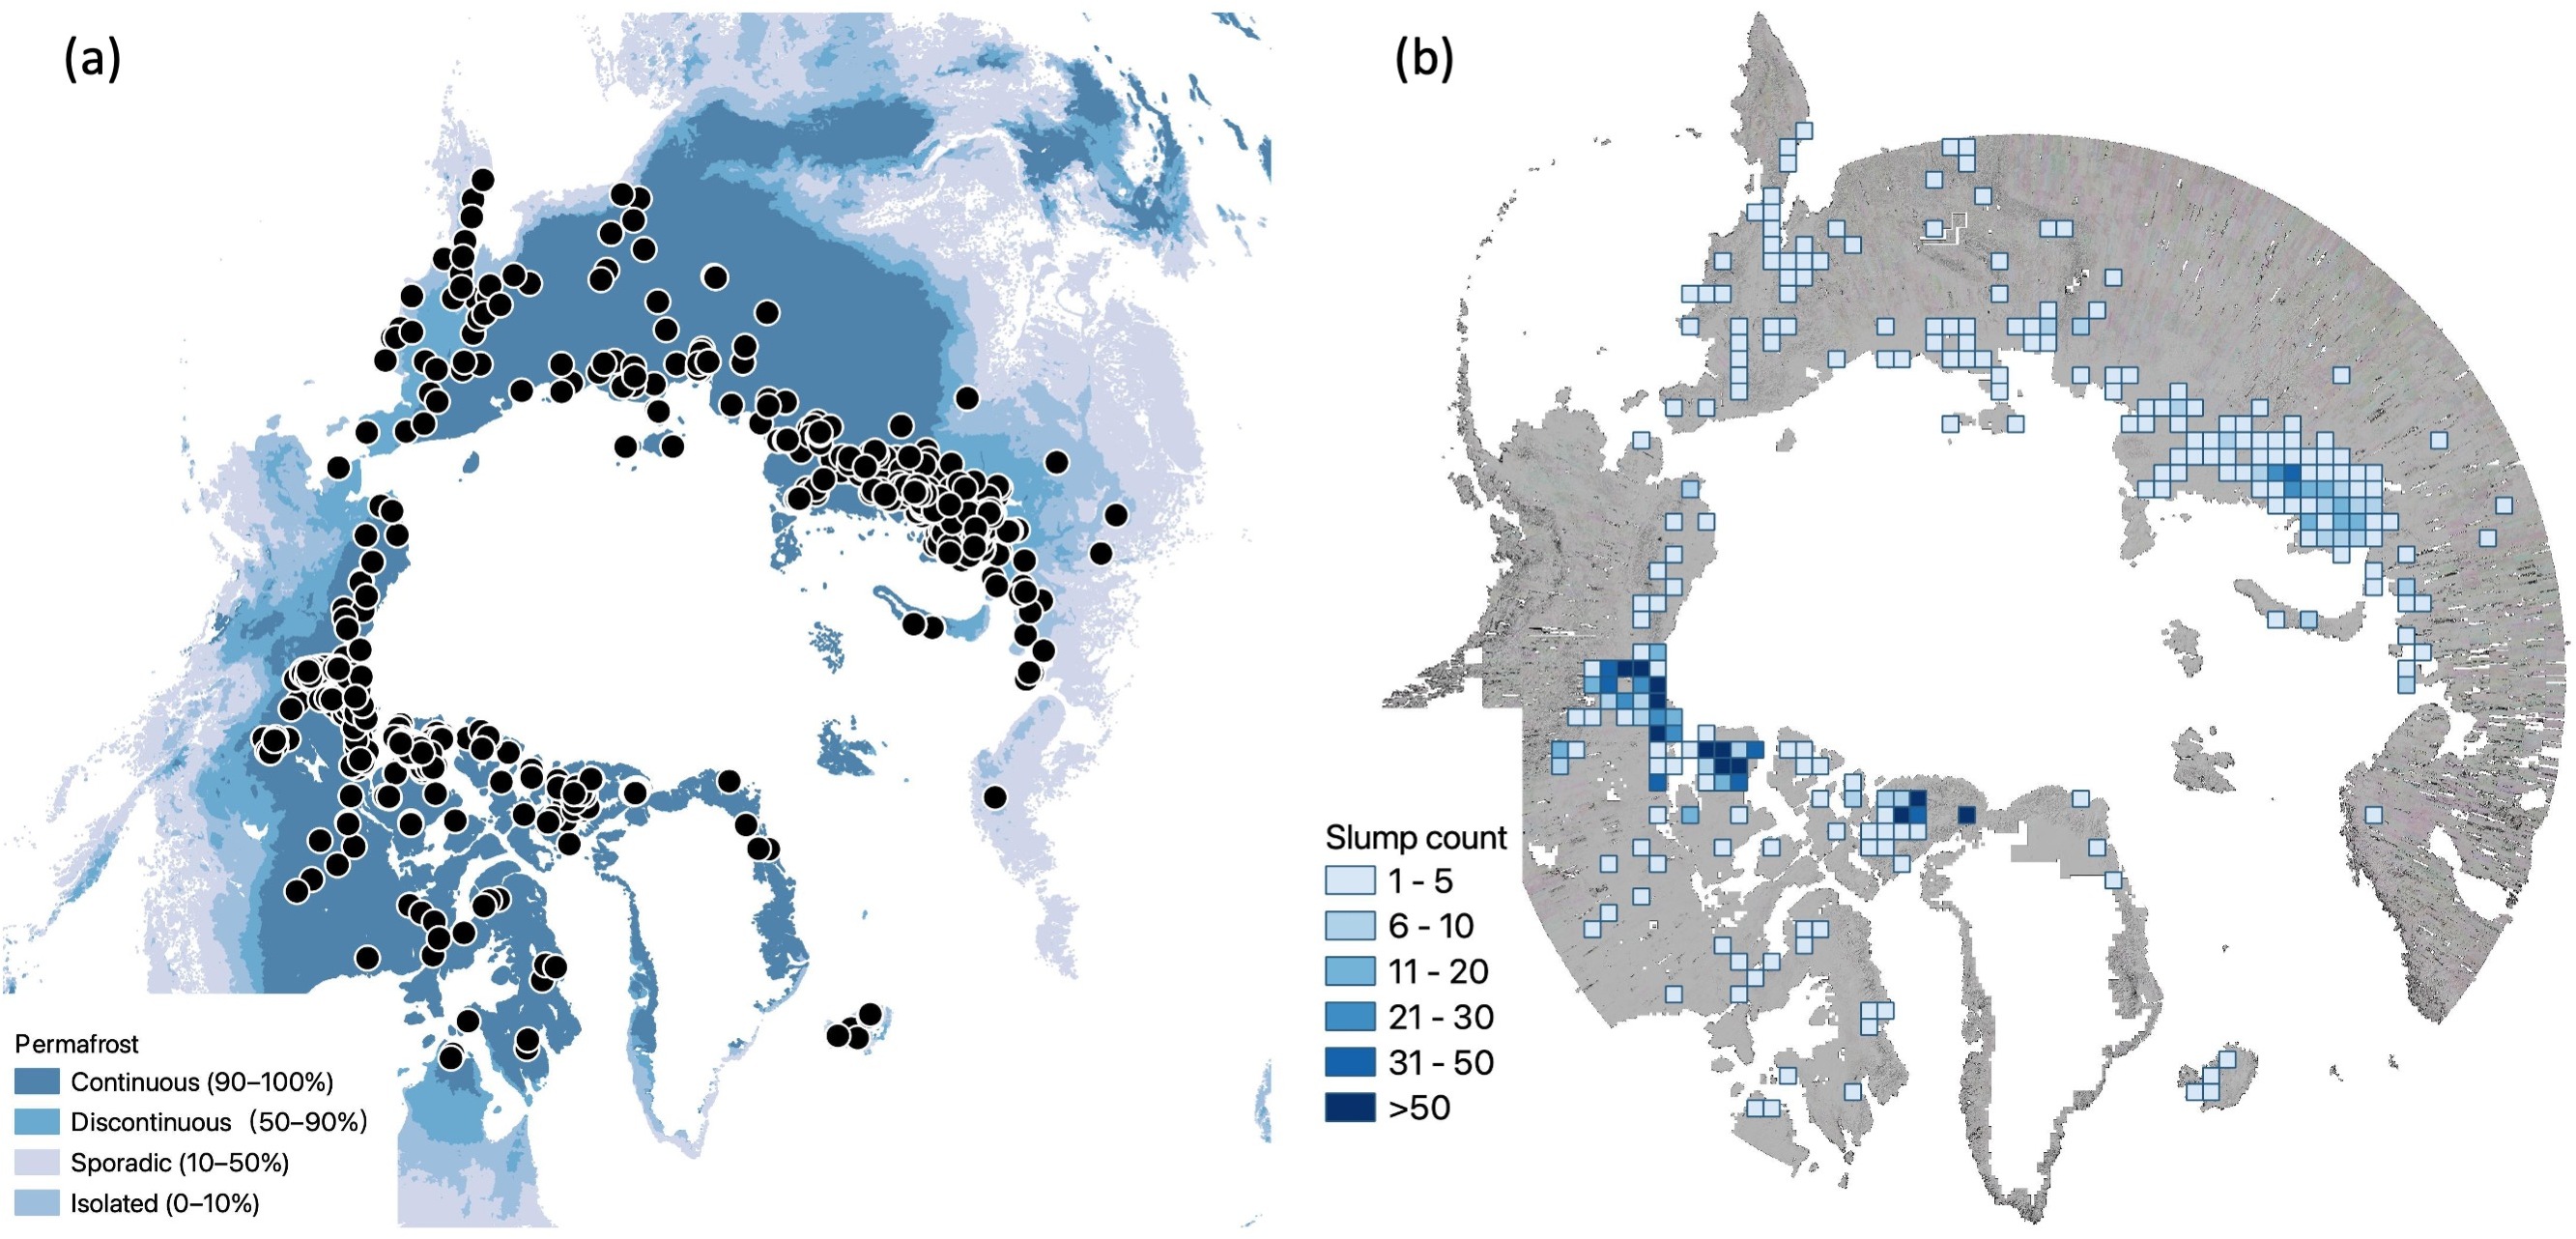
Hightlight: This study (Huang et al., 2023) is the first to map retrogressive thaw slumps (RTSs)—a type of abrupt permafrost thaw—on a near pan-Arctic scale using high-resolution (2 m) data. It developed an automated pipeline to process approximately 200 TB of data, combining feature extraction with deep learning to produce manageable results. Additionally, a crowdsourcing system was created to engage the broader community. Notably, a cluster of RTSs was identified in Greenland, a region where permafrost research remains limited. This work provides a critical foundation for understanding the spatial distribution of abrupt permafrost thaw, which is essential for assessing its impacts on Arctic ecosystems, global climate, and carbon release from permafrost.
I also contributed to multiple studies mapping abrupt permafrost thaw on the Tibetan Plateau and the Arctic, including Xia et al. (2024, 2022) and Huang et al. (2022, 2021, 2020, 2018). Beyond abrupt thaw, I participated in projects using SAR and InSAR techniques to derive changes in active layer thickness and to understand the gradual thawing of permafrost from the surface downward (Wig et al., 2025; Miller et al., 2024; Chen et al., 2023; Parsekian et al., 2021). I have been deeply engaged in international collaborations focused on monitoring permafrost thaw (Yang et al., 2025; Nitze et al., 2024).
Applying deep learing to remote sensing imagery
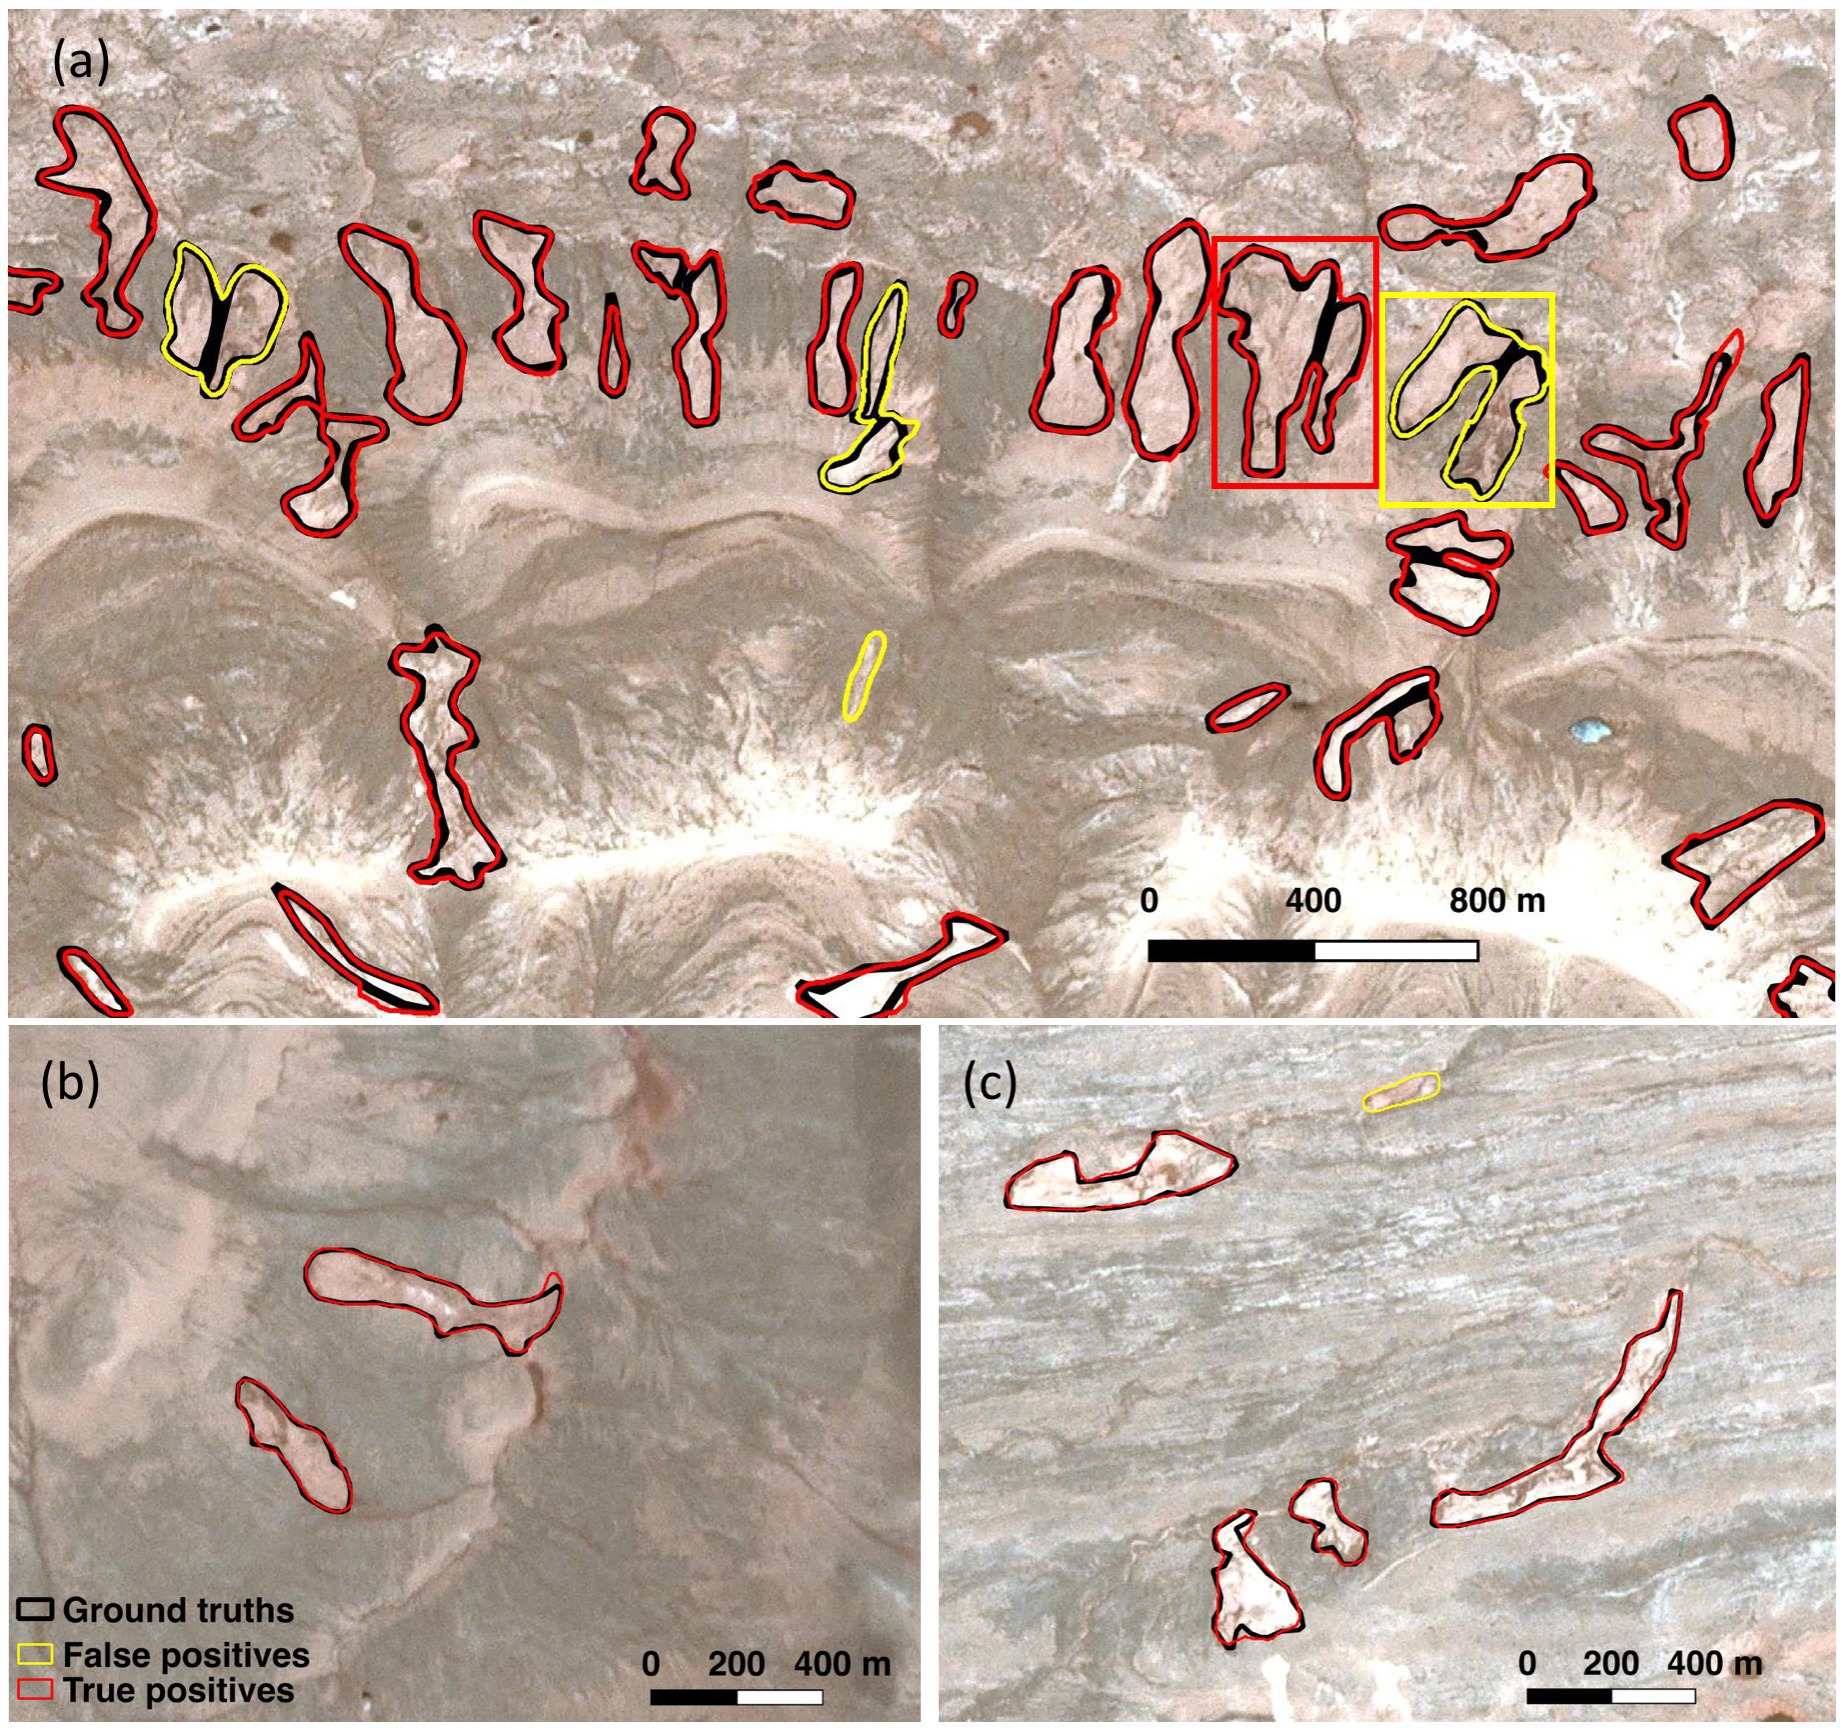 Hightlight: Huang et al., 2020 is the first to delineate thermokarst landforms using deep learning (DL) and high-resolution (3 m) Planet CubeSat images. As shown in the figure above, the DL output (red polygons) closely overlaps with manual delineation (black polygons), demonstrating the strong performance of the DL techniques. This study innovatively developed a workflow (i.e. BigImageMapper) based on the state-of-the-art DL techniques and open-source packages such as GDAL, RasterIO, and GeoPandas to automatically process large imagery and GIS vector data. It allows the direct input of large remote sensing imagery and vector data into DL algorithms and saves the DL output as GIS vector files, such as ESRI shapefiles, for further validation and analysis in GIS software. Parallel computing is used for huge datasets if computing resources are available.
By collaborating with colleagues from different research fields, I extended DL algorithms and a similar workflow to other remote-sensing-based Earth Observations. We applied the DL method to delineate the calving fronts of Greenland glaciers from multi-sensor remote sensing imagery (Zhang et al., 2019, 2021). Additionally, we combined InSAR and DL techniques to map and characterize rock glaciers in the arid Western Kunlun Mountains (Hu et al., 2023). I also contributed to work that used DL to map glacier lakes from multi-source satellite imagery (Xu et al., 2024). By comparing adaptive thresholding and DL for detecting flood extent in Houston, TX, using Sentinel-1A/B synthetic aperture radar, we concluded that thresholding is efficient and effective at identifying small-scale flood features in terms of precision. However, while the DL method was also effective and performed well in noisy regions, it may miss more small-scale features (Tiampo et al., 2022).
Image processing for understanding multiscale failure and compaction localization in triaxially compressed porous limestone
I contributed to rock physics projects that used 4D synchrotron X-ray imaging to observe the multiscale failure and compaction localization in porous limestone. The research provides detailed insights into the multiscale dynamics of rock failure, ranging from the grain scale to the continuum scale, by conducting a single triaxial compression experiment on Leitha limestone and performing 4D image analysis (Huang et al., 2019; Meng et al., 2022a and 2022b).